Colima
Cacao was one of the first crops the Spanish introduced to Colima in the 16th century, followed by coconut, sugar cane and cotton.
Capital: Colima · Area: 5,627 km² · Checked 3 Nov 2026

Colima at a glance
INEGI publishes IMMEX export-plant counts by state only in its database, not in the monthly bulletin we could read, so no count is shown here rather than an estimate; where Book 6 gives a share, it is in the text below.
This is Colima
Cacao was one of the first crops the Spanish introduced to Colima in the 16th century, followed by coconut, sugar cane and cotton. In 1919 a cooperative received exclusive rights to extract salt from the Cuyutlán lagoon. Rail service between Colima city and the port of Manzanillo began in 1889. In the 1940s the Tecomán Valley was put under intensive cultivation, with limes as its principal crop, and Tecomán lime juice is still the base of local ceviche. Peña Colorada is the largest iron deposit in the country. The coconut palm is a state symbol, and tuba, a drink tapped from its flowers, came from the Philippines. The 2020 census counted 731,391 residents. The University of Colima was founded on 16 September 1940 as the Universidad Popular de Colima. 18

Who it suits
Colima suits an importer moving Asian components inland through Manzanillo, with any structure built to seismic zone D, but it lacks the labor market behind Guadalajara. 5
The ports suit importers and companies moving Asian components inland, and Lázaro Cárdenas suits a shipper bound for the Bajío or Laredo by rail; neither Colima nor coastal Michoacán carries Guadalajara’s labor market behind it.
What to check first
- Start with power: ask CFE in writing what it can connect at the candidate park and when, and ask whether the park self-supplies.
- Confirm that the developer is certified under the April 2026 agreement and that the site sits in one of the 8 municipalities.
- Get the latest vacancy figure for the submarket from at least 2 brokers, because published figures vary from 1.2% to 6.0% within a year.
- Choose the port and the route before the site, and check the security of the highway the trucks will use, not the state average.
- In Colima and on the coast, have the structure checked against zone D.
- For Michoacán and Sinaloa, ask IMSS for the series in the municipality itself, because state totals are moving.
Weighing Colima for a plant, a warehouse or an office? Work with us.
Industry and plants
Containers come ashore here; little is made for export. INEGI’s state indicator found activity 3.8% larger in the first quarter of 2026 than a year earlier, third-fastest of the 32. 5
Colima posted 1.6% unemployment in the second quarter of 2026 (INEGI), versus 2.7% nationally; informality was 46.2% versus 55.1%. Lokus Data’s IMSS series showed 158,302 formal jobs in July 2026, up 2.4% in a year. 5
Output by sector, 2024
Share of the state’s output, current prices 16
- 67.7%Services +3.0% real, 2024
- 21.7%Industry: manufacturing, construction, energy, mining +1.2% real, 2024
- 6.1%Agriculture, livestock, fishing +1.9% real, 2024
- 4.5%Taxes on products, net
Among the 32, measure by measure
Each bar is one state, largest on the left, in the colour of its corridor; Colima is the bright one with the white edge. 1 2 3 7 6
Beside its neighbours in the West
Share of Mexico’s output, 2024
Exports, 2025
Formal private jobs, July 2026
Informal work, Q2 2026
Colima against Mexico
Coloured: the state. Grey: the whole country.
Safety, taxes and incentives
INEGI counted 2,720 businesses victimized per 10,000 in 2023, level with the national average of 2,722. The Mexico Peace Index 2026 ranks Colima last of 32, and the USA advisory of May 29, 2026, sets Level 4, don’t travel. 5
The payroll tax rose from 2% to 3% for 2026 (BHR). The World Bank ranked Colima first of 32 on construction permits in 2016. A governor is elected June 6, 2027. 5
Cities, ports, airports, crossings, power and water
Colima
The capital: 146,965 people (2020) 17
Manzanillo
City: 159,853 people (2020) 17
Villa de Álvarez
City: 147,496 people (2020) 17
Licenciado Miguel de la Madrid Airport
International airport (CLQ) · 250,146 passengers in 2025 17
Playa de Oro International Airport
International airport (ZLO) · 228,999 passengers in 2025 17
Port of Manzanillo
Commercial seaport 17
Ferromex (with Ferrosur; 12,100 km combined)
Rail line serving the state 17
Power and water
An analyst tied June 2026 outages here to distribution, not generation. In September 2025, CONAGUA said a new aqueduct will carry 800 liters per second for 238,000 residents by early 2027. 5
Logistics and crossings
Manzanillo, the largest container port, moved 3,893,357 TEU in 2025, about 0.8% fewer than in 2024 (port authority). 5
Development pole
No federal development pole has been declared here. 5
The recent arrivals
- Book 6 records no dated plant announcement for this state.
Colima’s average daily IMSS contribution wage was 604.54 pesos in July 2026, ranking seventeenth of the 32, below the national average of 673.9. 5
Book 6’s cost model prices only Monterrey, Querétaro and Mérida in full.
Rent per square metre, freight to your customers and the fully loaded cost of your own workforce are figures we prepare for each client, not numbers to publish: work with us.
Sources, each with its date
- INEGI, Encuesta Intercensal 2025 (people in private dwellings; median age from the tabulates), 22 Sep 2026 · link
- INEGI, PIB por Entidad Federativa 2024, current prices; share our arithmetic over the national 33,506,847 million pesos, 5 Dec 2025 · link
- INEGI, Exportaciones Trimestrales por Entidad Federativa, the four quarters of 2025 summed (our arithmetic), preliminary, 31 Mar 2026 · link
- Wikipedia, List of states of Mexico, citing INEGI (continental area, 2016), 22 Oct 2026 · link
- Book 6, Where to Go in Mexico, Part V, with the sources listed there, Nov 2026 · link
- INEGI, ENOE second quarter 2026, bulletin 503/26, as compiled in Book 6, Part V, 25 Aug 2026 · link
- IMSS open data as processed by Lokus Data (private formal jobs and average daily contribution wage; the national wage of 673.9 pesos covers all IMSS-insured workers), as compiled in Book 6, Jul 2026 · link
- Book 6, Where to Go in Mexico, chapter 17, The West, with the sources listed there, Nov 2026 · link
- INEGI, quarterly state exports, bulletin 609/26, as compiled in Book 6, 30 Sep 2026 · link
- Secretaría de Economía, foreign direct investment by state of destination, as reproduced by the Chamber of Deputies, Gaceta Parlamentaria, 14 Apr 2026 · link
- IMCO, Índice de Competitividad Estatal 2026, 21 Sep 2026 · link
- BHR, bulletin on state payroll-tax rates for 2026, as compiled in Book 6, Jan 2026 · link
- Institute for Economics and Peace, Mexico Peace Index 2026; USA Department of State travel advisory of 29 May 2026, 29 May 2026 · link
- INEGI, ENVE 2024 (businesses victimized in 2023, per 10,000), 10 Dec 2024 · link
- INEGI, ITAEE first quarter 2026 (change on a year), from Book 6, Figure VII.18, Nov 2026 · link
- INEGI, PIB por Entidad Federativa 2024, the state's press release (shares at current prices, growth at constant prices; taxes on products are 100 less the three activities, our arithmetic), 5 Dec 2025 · link
- Wikipedia, the city, airport, port and crossing pages (EN and ES), read 3 November 2026, 3 Nov 2026 · link
- Wikipedia and the pages listed: Colima (en); Colima (es); Universidad de Colima (es), 3 Nov 2026 · link
- Book 6, Where to Go in Mexico, chapter 12, The Landed Cost and Time to Production, State by State, Nov 2026 · link
Pictures
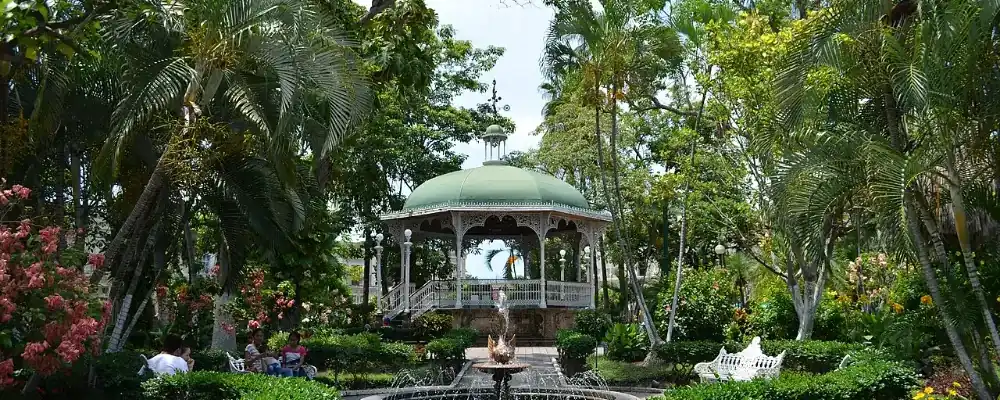
- Jardín Libertad, Colima: Irene Soria Guzmán, CC BY 2.0, Wikimedia Commons
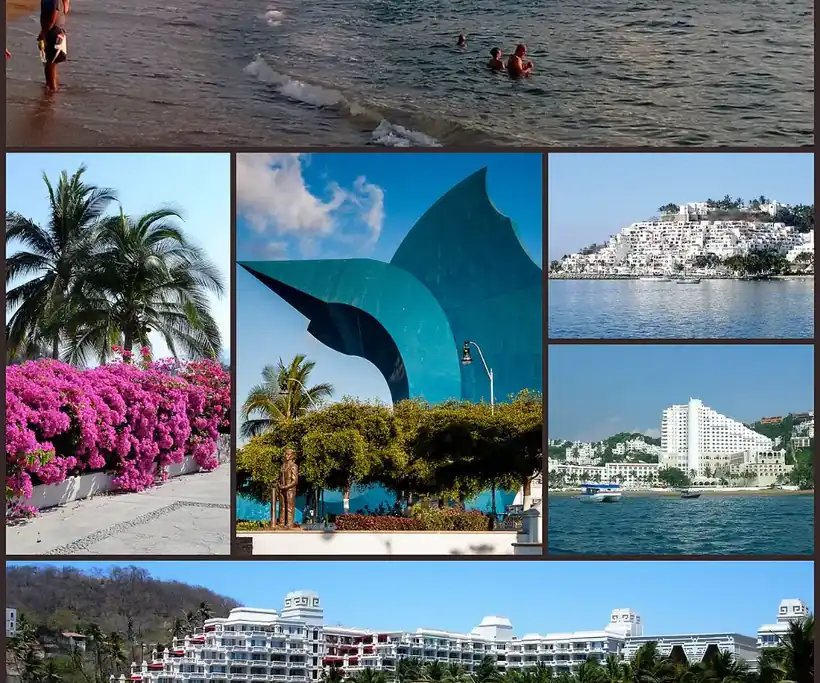
- Montaje de Manzanillo: Montaje realizado por User:Wovedro., CC BY-SA 4.0, Wikimedia Commons